Ottermon AI Monitoring Platform
A simplified DataDog alternative designed for rapid issue identification and resolution. Get to critical system issues in 3 clicks or less with intuitive visual design and streamlined workflows.
Design Philosophy
Simplifying complex monitoring through visual design and intuitive navigation
Visual First
Color-coded health indicators provide instant system status understanding at a glance, eliminating the need to parse complex data tables.
3-Click Rule
Every critical issue can be identified and accessed within 3 clicks, streamlining the troubleshooting workflow for faster resolution times.
Contextual Information
Rich contextual data is presented only when needed, reducing cognitive load while maintaining comprehensive monitoring capabilities.
Unified Interface
Single dashboard view combines multiple monitoring aspects, eliminating the need to switch between different tools and views.
Visual Design Highlights
Interface designs showcasing the simplified monitoring approach
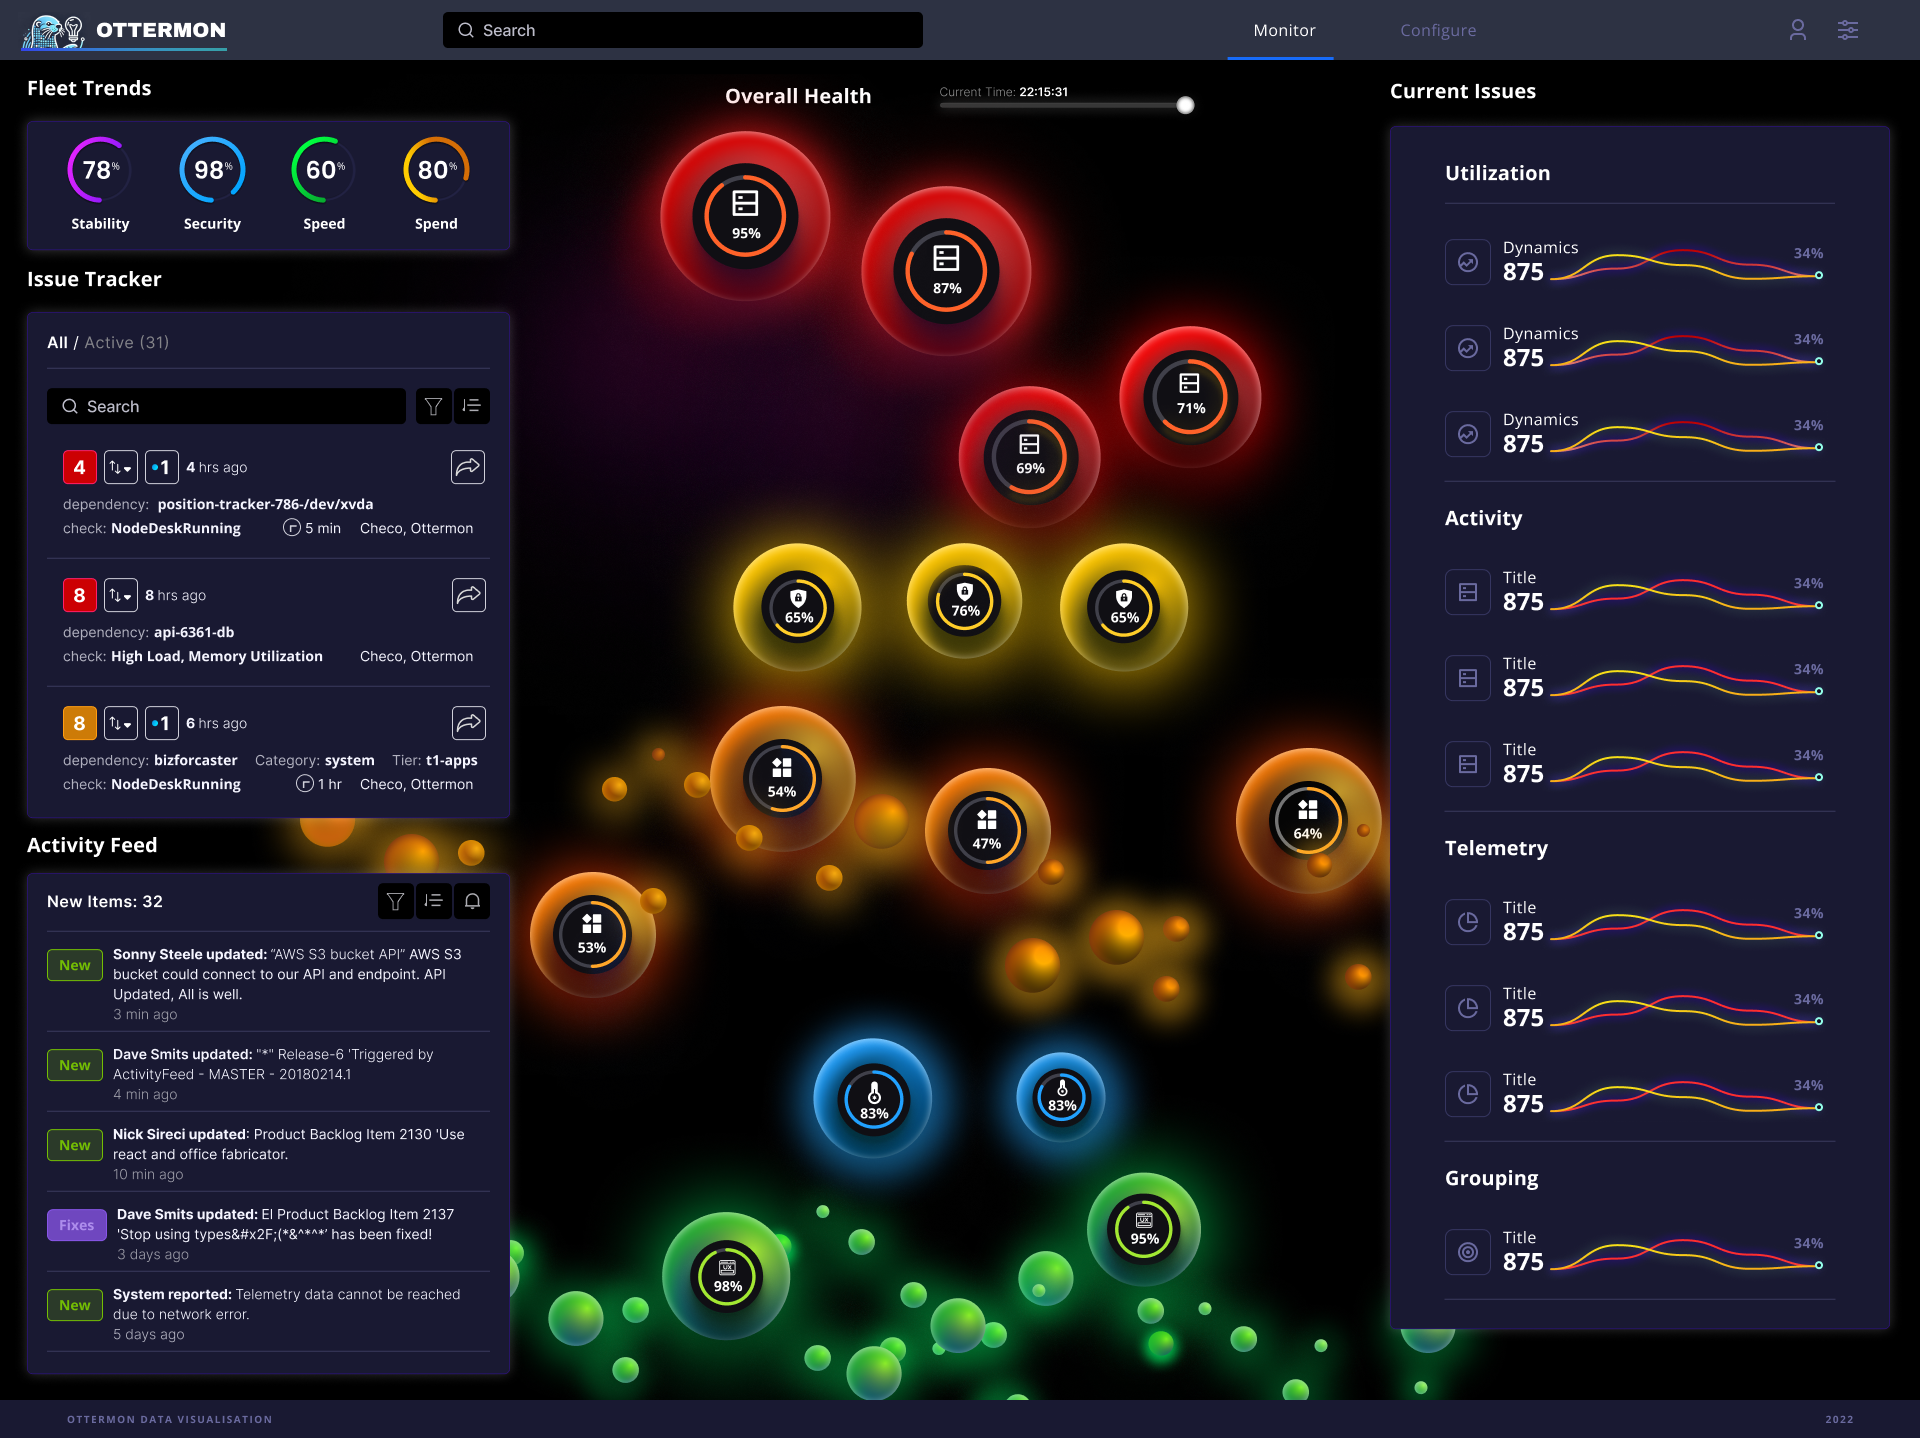
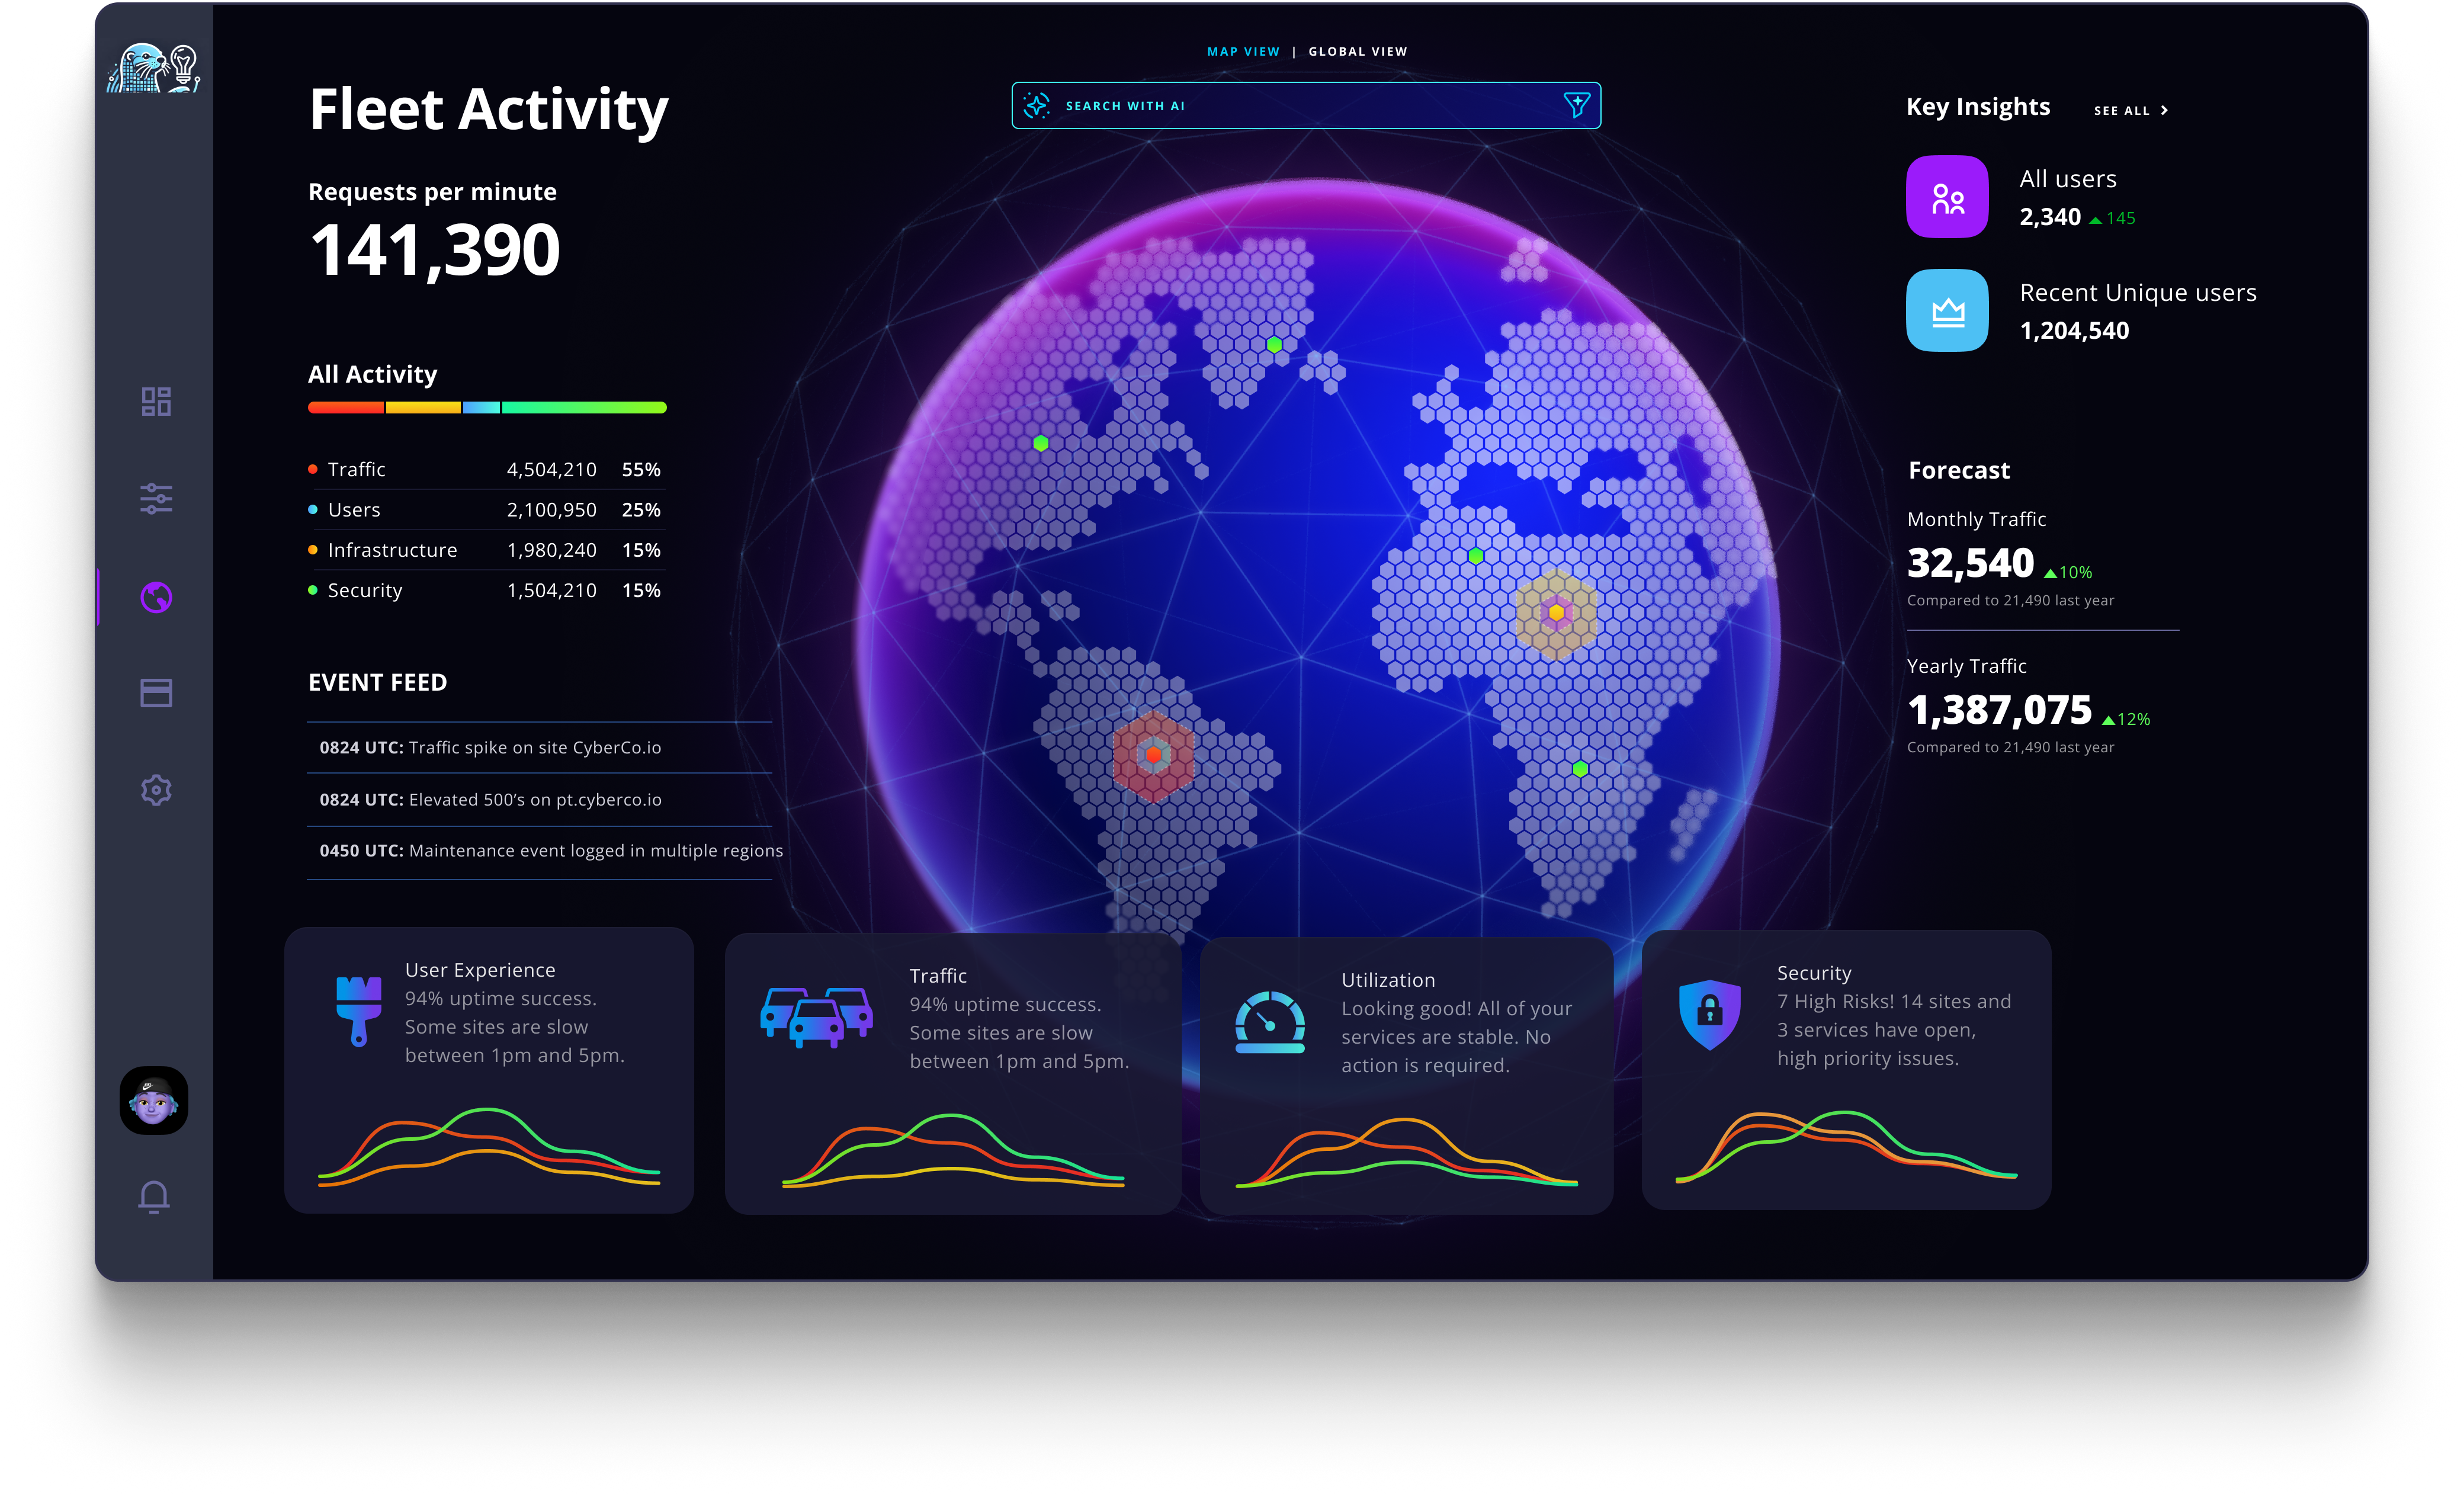
Main Dashboard Overview
Central hub displaying system health with color-coded visual indicators. Issues are immediately visible through red indicators, while healthy systems show in green and blue tones.
Issue Detail View
Comprehensive issue breakdown with contextual information, timeline data, and actionable insights presented in a clean, scannable format.
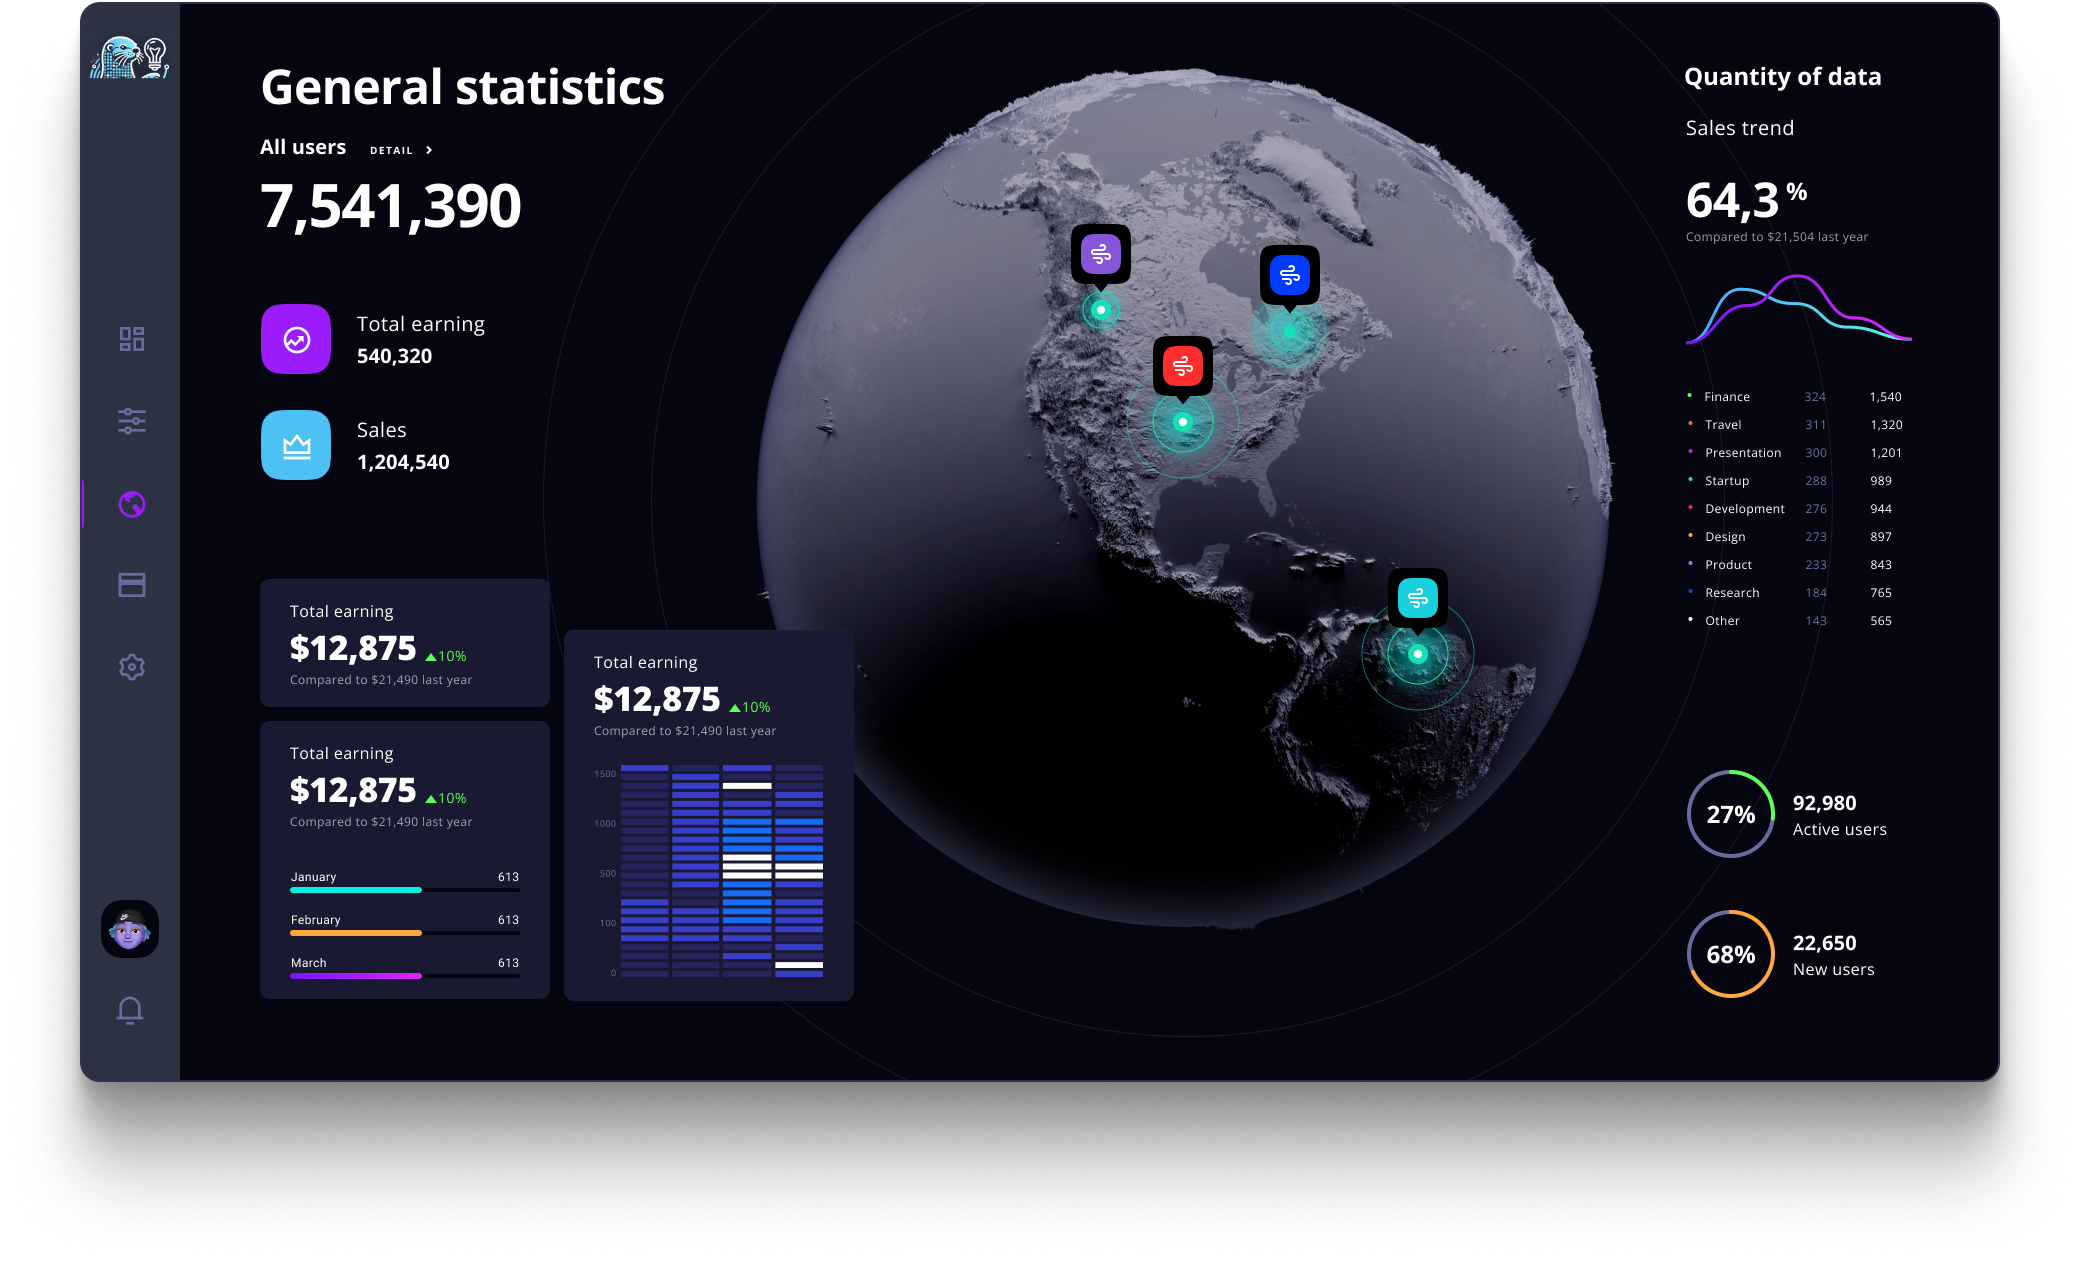
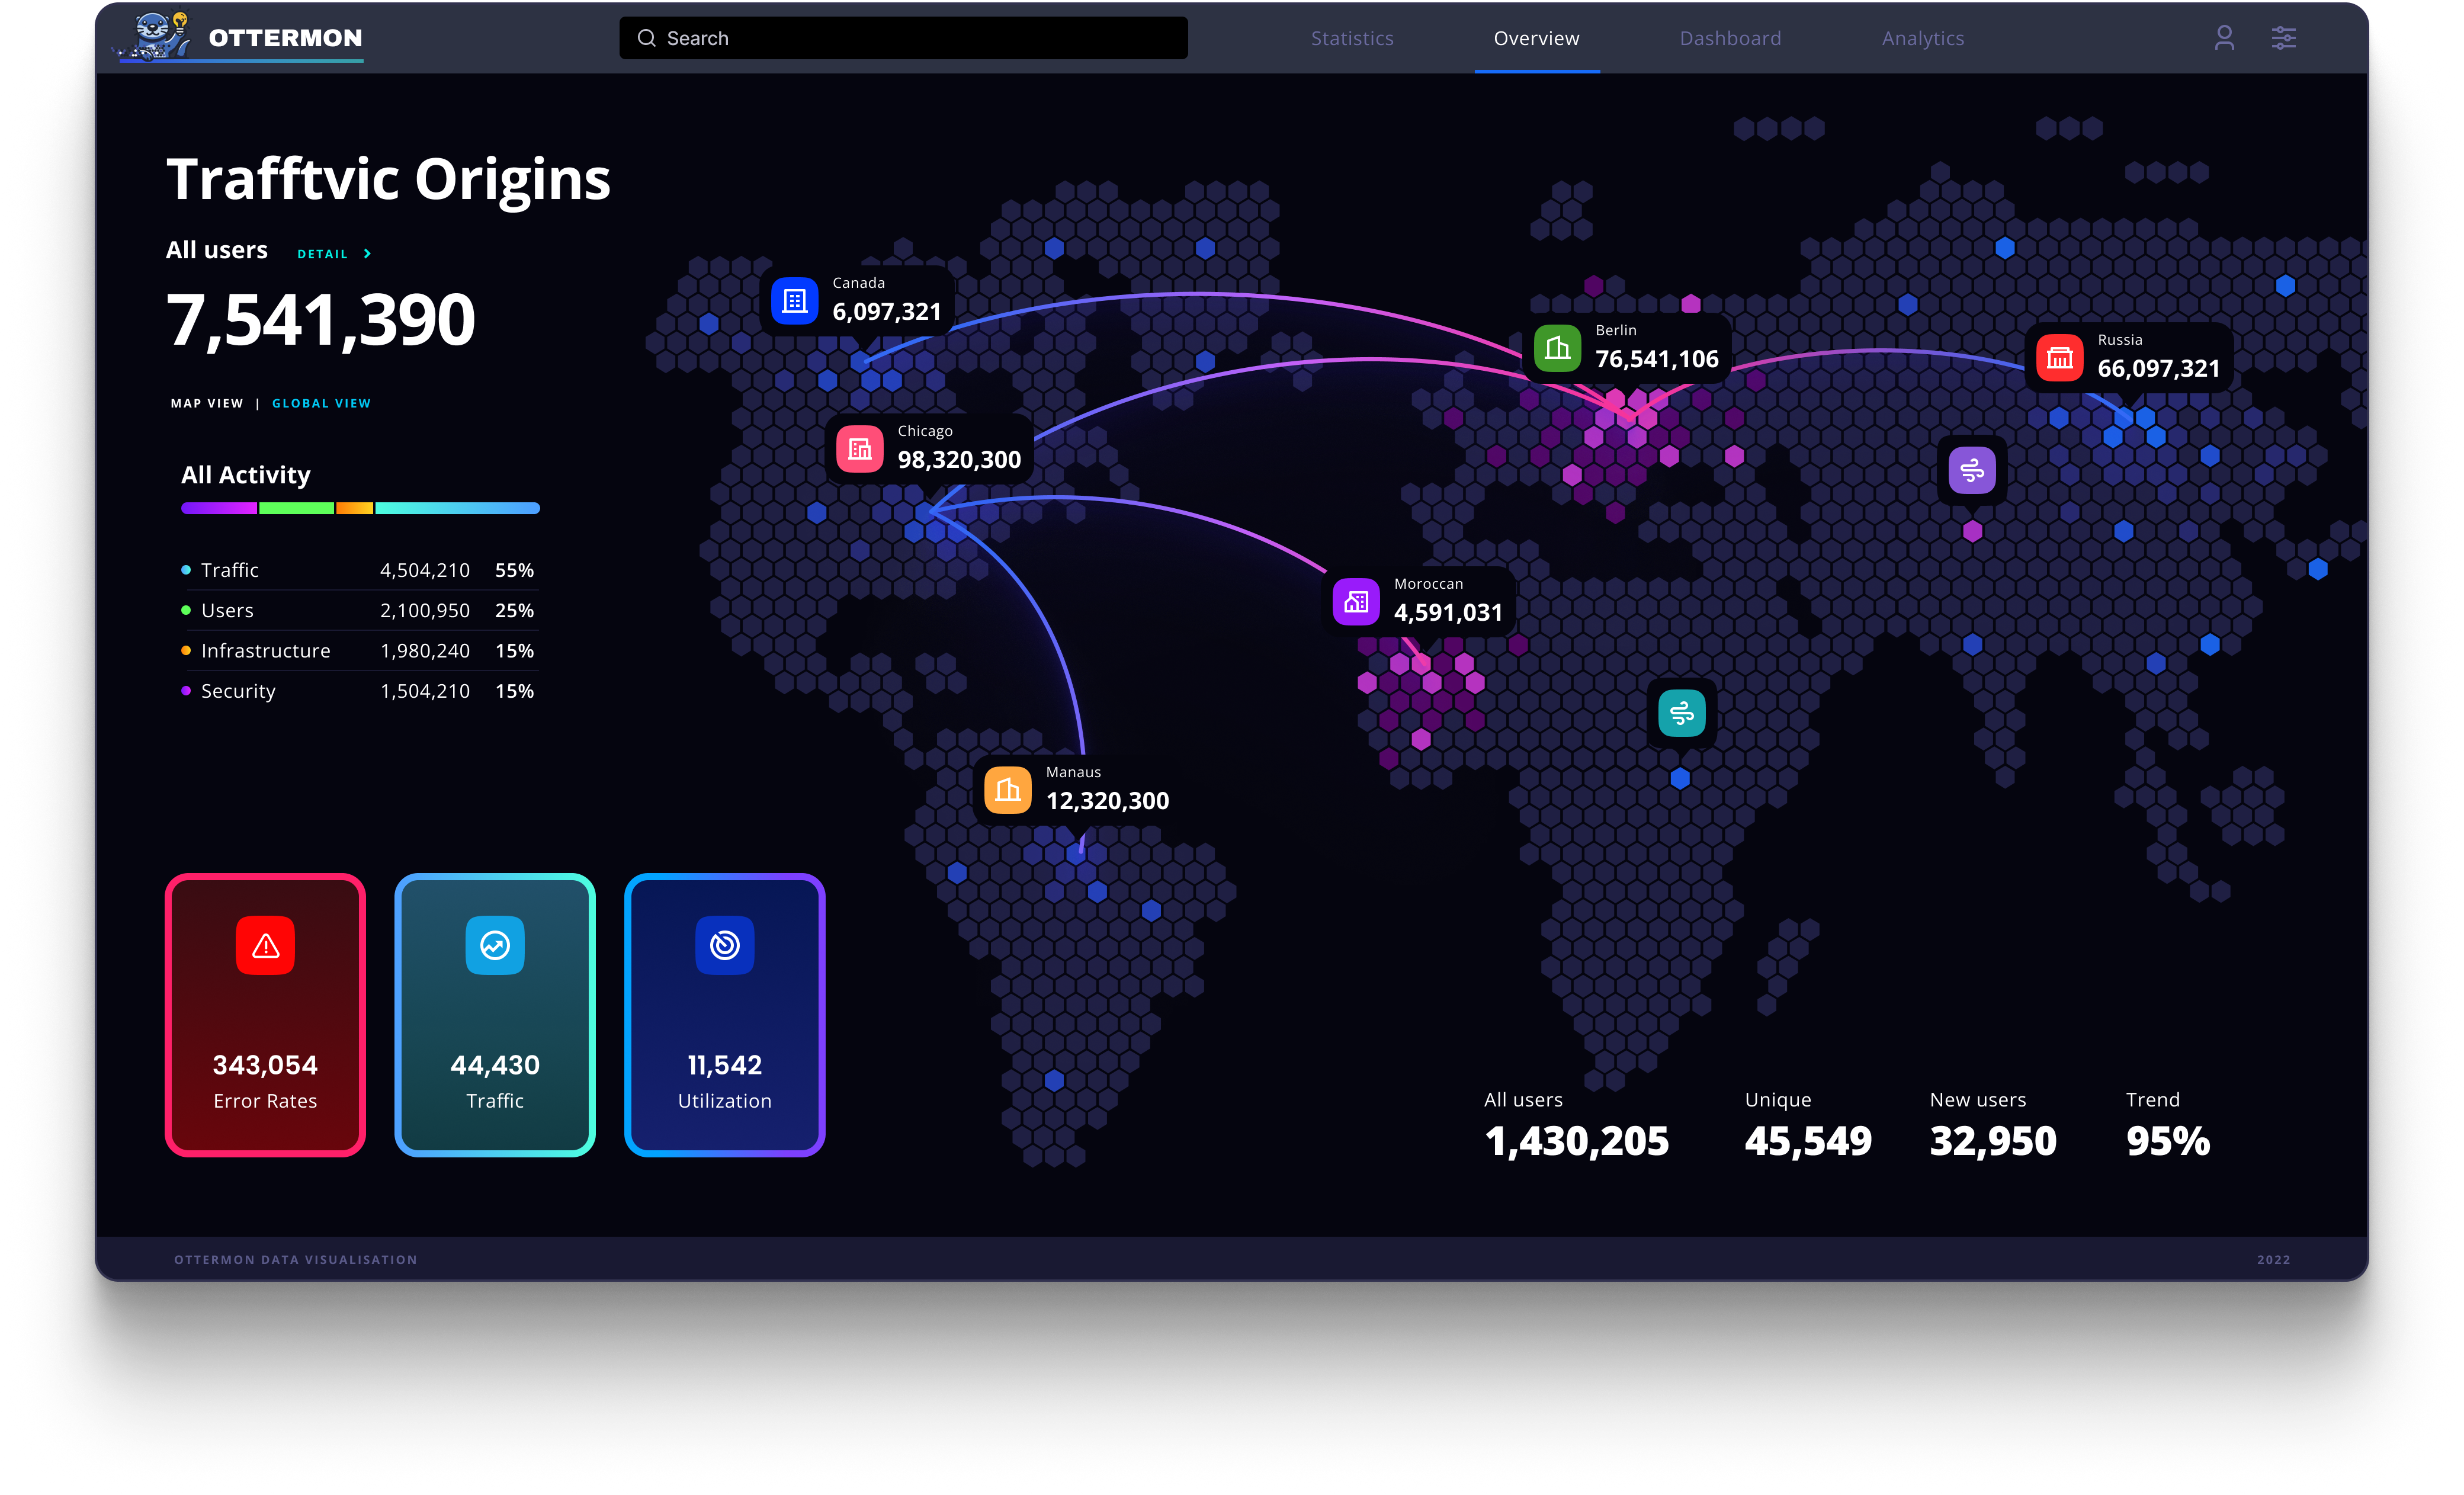
System Metrics Interface
Real-time performance metrics with intuitive visualizations that make complex data immediately understandable for quick decision making.
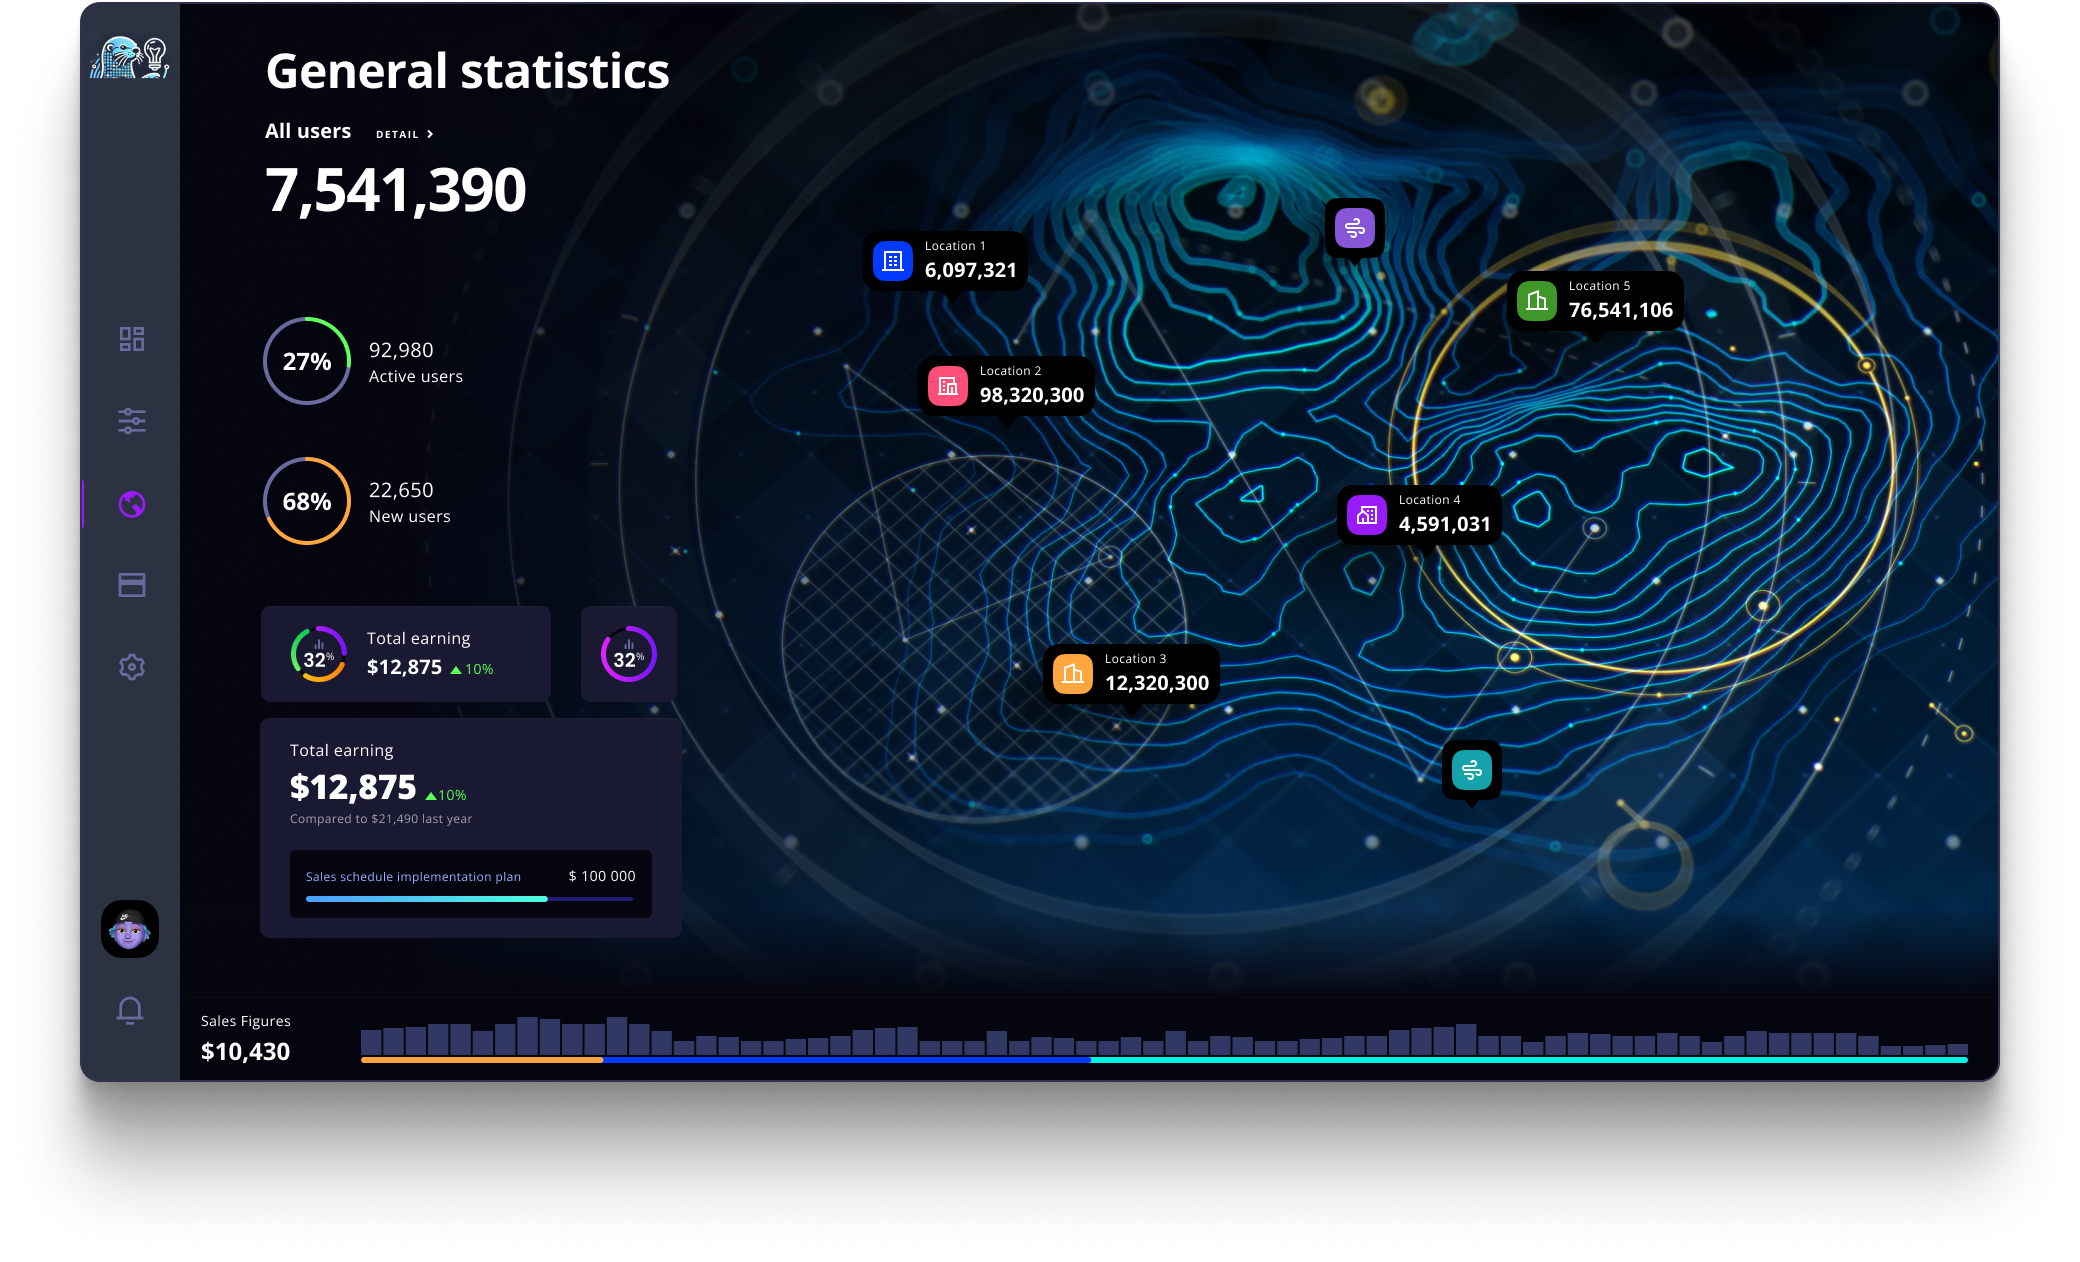
Alert Management System
Streamlined alert interface prioritizing critical issues while providing clear paths to resolution and prevention strategies.
Configuration Interface
Simplified setup and configuration flows that reduce complexity while maintaining powerful monitoring capabilities and customization options.
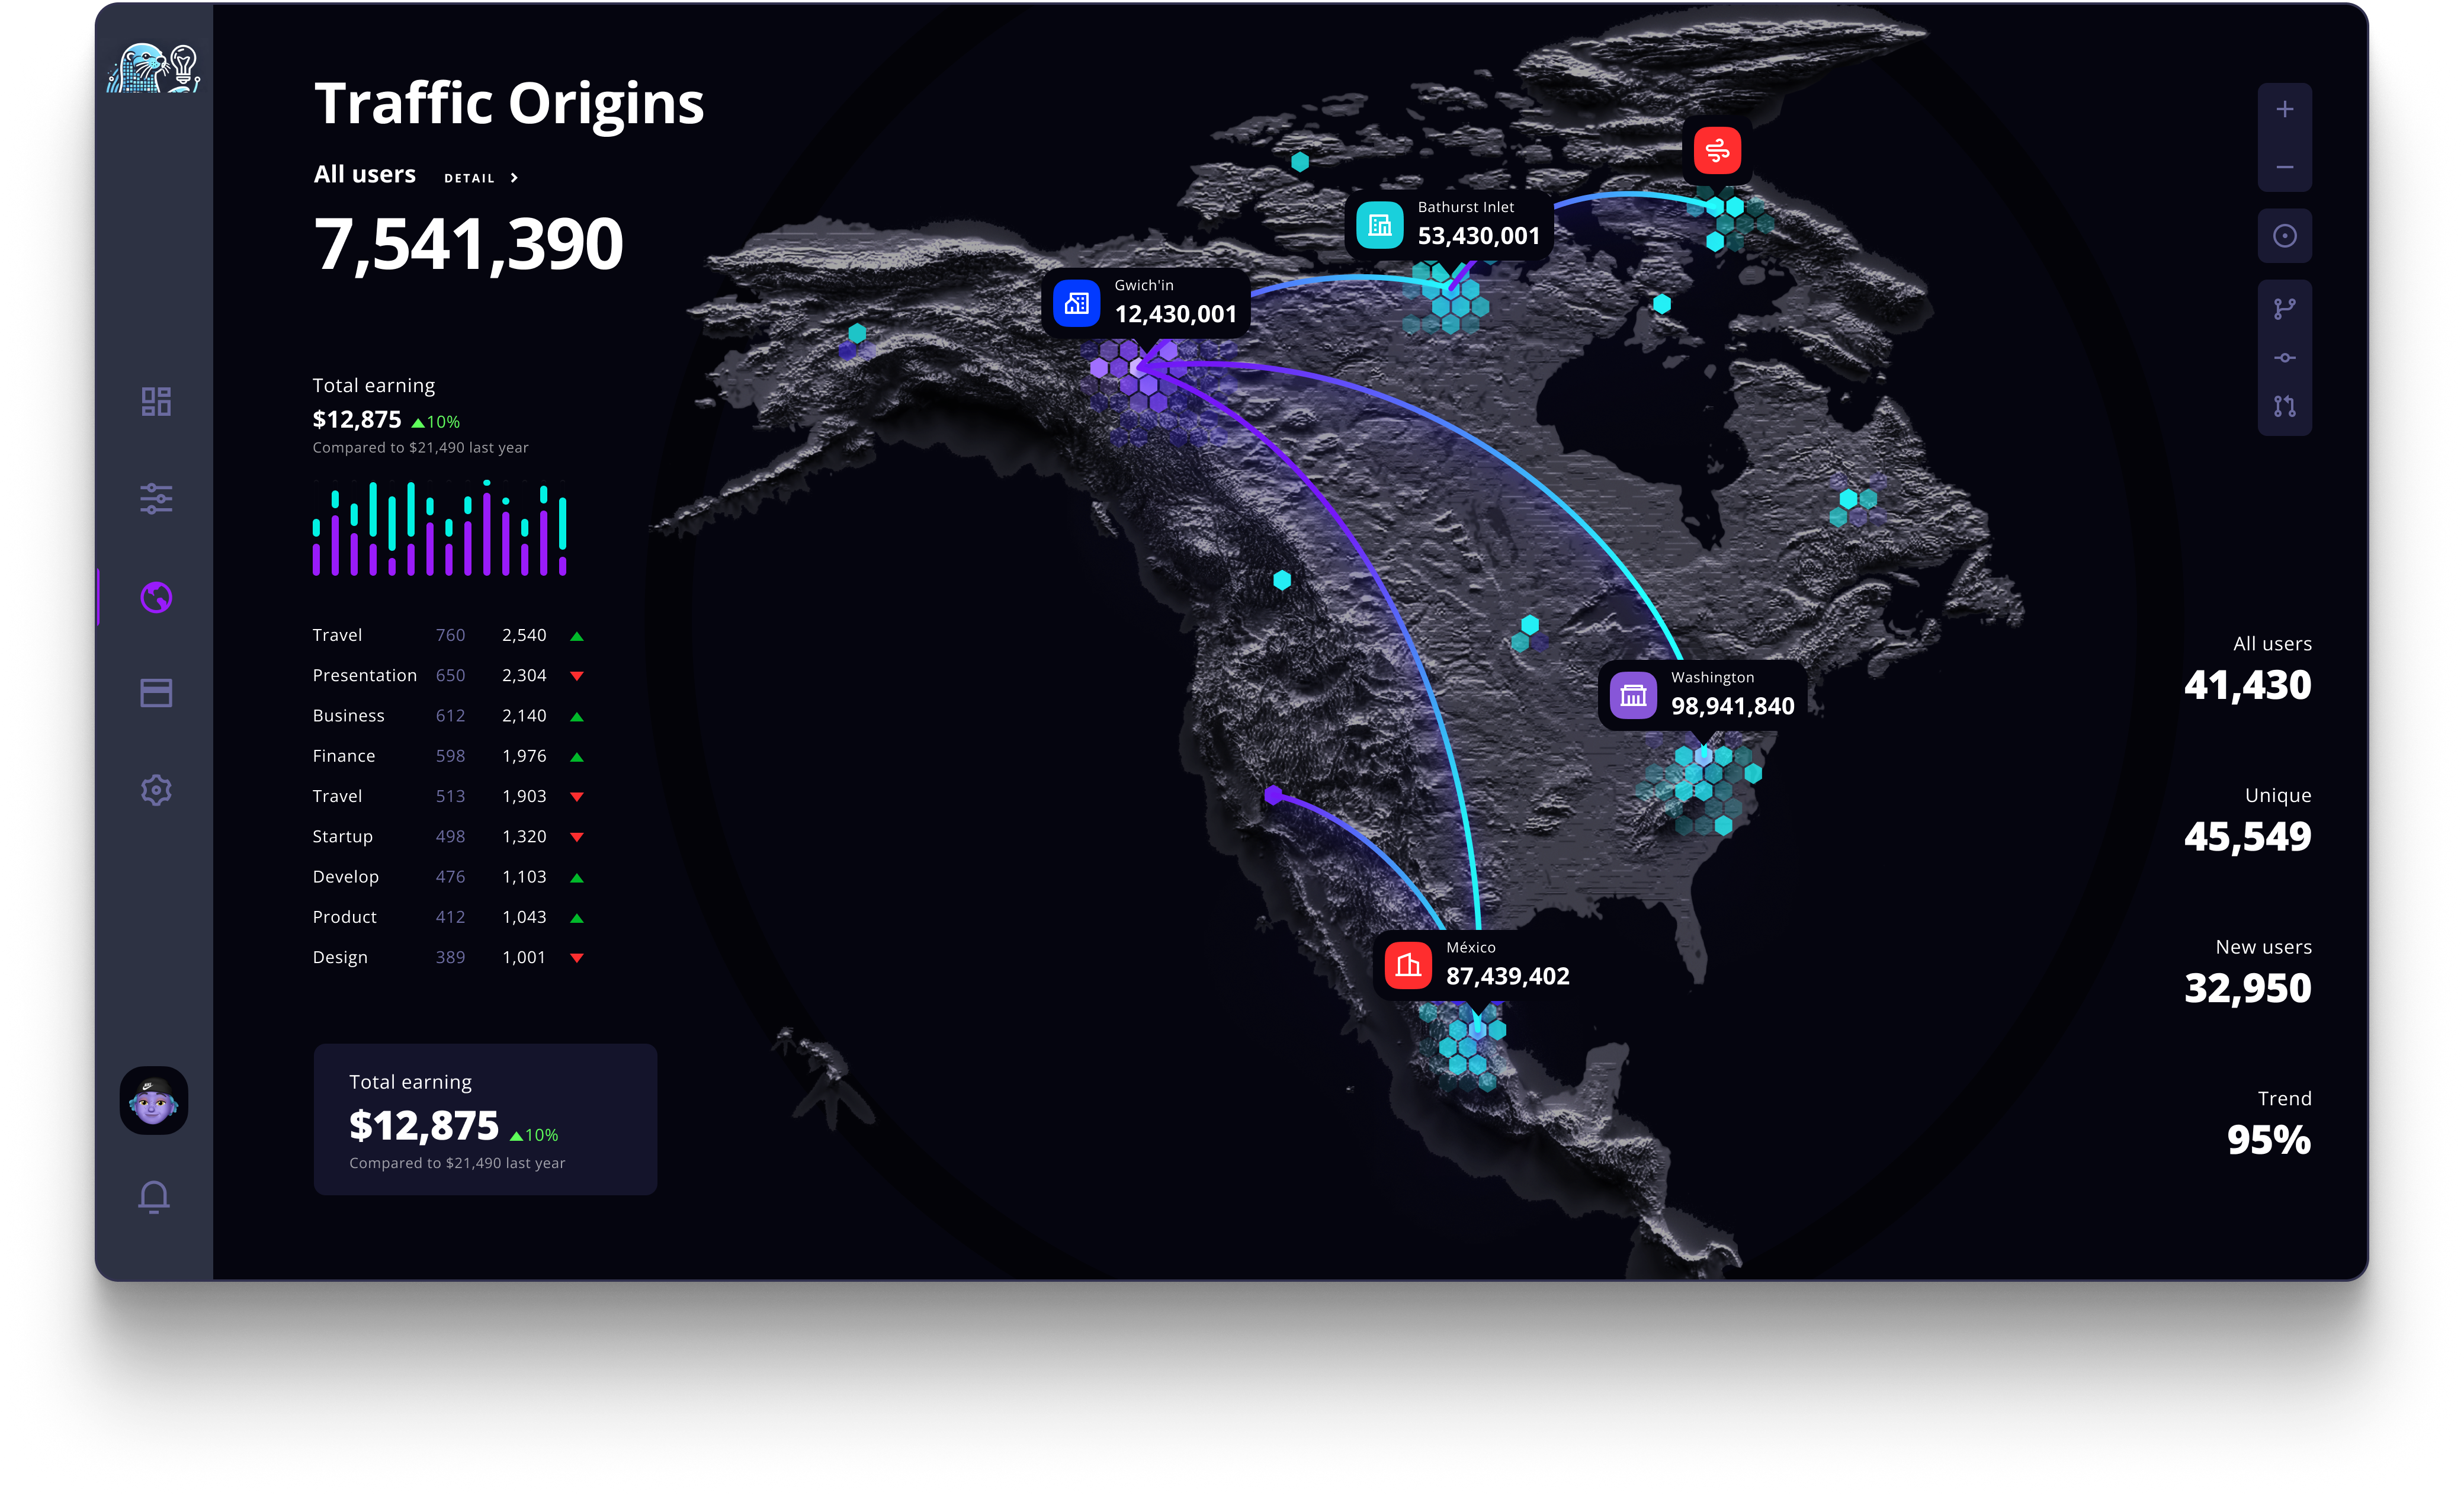
Integration Management
Seamless integration interface connecting various monitoring tools and services with clear status indicators and management controls.
Key Features
Core capabilities that simplify system monitoring and issue resolution
Instant Issue Detection
Visual health indicators immediately highlight system problems without requiring data analysis.
3-Click Resolution
Streamlined navigation paths ensure critical issues are accessible within three clicks maximum.
Visual Data Presentation
Complex metrics presented through intuitive visualizations for faster comprehension and decision making.
Smart Alert Prioritization
Intelligent alert system that surfaces the most critical issues while reducing noise and false positives.
Real-time Monitoring
Live system status updates with minimal latency for immediate awareness of changing conditions.
Simplified Configuration
Easy setup and customization without compromising on monitoring depth and capability.
Design Impact
Measurable improvements in monitoring efficiency and user experience
Faster Issue Resolution
Reduced time from issue detection to resolution through streamlined navigation and clear visual indicators.
Reduced Cognitive Load
Simplified interface design significantly decreased mental effort required to understand system status.
Improved User Adoption
Intuitive design led to faster onboarding and higher user satisfaction compared to traditional monitoring tools.
Visual Clarity
Color-coded health indicators provided immediate system status understanding for 90% of use cases.